Understanding Content Engagement Metrics dives into the world of tracking digital impact, shedding light on how businesses analyze and enhance their online presence. Get ready to uncover the secrets behind successful content engagement strategies!
What are Content Engagement Metrics?
Content engagement metrics are key performance indicators (KPIs) used to measure how audiences interact with a piece of content. These metrics provide insights into how users engage with content on various platforms, such as websites, social media, or email campaigns.
Importance of tracking content engagement metrics
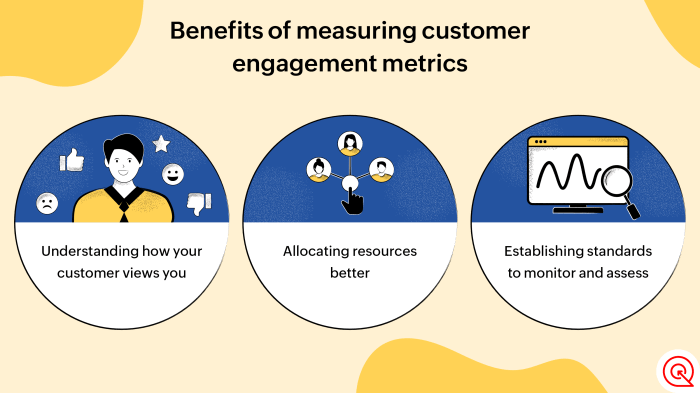
Tracking content engagement metrics is crucial for digital marketers to understand the effectiveness of their content strategies and make data-driven decisions. By analyzing these metrics, marketers can optimize their content to better resonate with their target audience and improve overall engagement.
- Click-through Rate (CTR): This metric measures the percentage of users who clicked on a specific link or call-to-action within a piece of content. A high CTR indicates that the content is engaging and compelling to the audience.
- Time on Page: Time on page measures how long users spend on a particular webpage. A longer time on page suggests that the content is valuable and engaging to the audience.
- Social Shares: Social shares indicate how many times a piece of content has been shared on social media platforms. This metric reflects the content’s reach and resonance with the audience.
- Bounce Rate: Bounce rate measures the percentage of users who navigate away from a webpage after viewing only one page. A high bounce rate may indicate that the content is not engaging or relevant to the audience.
Types of Content Engagement Metrics: Understanding Content Engagement Metrics

When it comes to measuring how well your content is resonating with your audience, there are two main types of metrics to consider: quantitative and qualitative content engagement metrics. Let’s break down the differences and how each type is measured.
Quantitative Content Engagement Metrics
Quantitative content engagement metrics focus on the numerical data that shows how users are interacting with your content. These metrics are easily measurable and provide concrete data on the performance of your content. Some examples of quantitative content engagement metrics include:
- Page views: The number of times a page is viewed by users.
- Click-through rate (CTR): The percentage of users who click on a link after seeing it.
- Time on page: The amount of time users spend on a page before navigating away.
- Conversion rate: The percentage of users who take a desired action, such as making a purchase or filling out a form.
Qualitative Content Engagement Metrics
On the other hand, qualitative content engagement metrics provide insight into the quality of user interactions with your content. These metrics are more subjective and focus on the sentiment and overall user experience. Some examples of qualitative content engagement metrics include:
- Feedback and comments: User-generated feedback that provides insights into user sentiment and preferences.
- Social shares: The number of times your content is shared on social media platforms.
- Brand sentiment: The overall perception of your brand based on user interactions with your content.
- User surveys: Direct feedback from users about their experience with your content.
Interpreting Content Engagement Metrics

When analyzing content engagement metrics, it’s crucial to understand how to interpret spikes or drops in the data. These fluctuations can provide valuable insights into audience behavior and preferences, helping you make informed decisions to improve your content strategy.
Interpreting Spikes or Drops
- Spikes in engagement metrics could indicate that a particular piece of content resonated well with your audience. It may have been shared widely, generated meaningful conversations, or sparked interest in your brand.
- On the other hand, drops in engagement could signal that the content did not captivate your audience as expected. It might be a sign to reassess your content quality, relevance, or distribution channels.
- It’s essential to look for patterns and correlations to understand the context behind these spikes or drops, rather than making assumptions based on isolated data points.
Significance of High or Low Engagement Rate
- A high engagement rate indicates that your content is resonating well with your audience, driving interactions, and building brand loyalty. It shows that your content is valuable and relevant to your target audience.
- Conversely, a low engagement rate may suggest that your content is not connecting with your audience effectively. It could be a signal to reevaluate your content strategy, messaging, or targeting to improve engagement levels.
- Understanding the significance of these rates can help you align your content efforts with audience preferences and optimize your content for better performance.
Strategies for Improving Content Engagement, Understanding Content Engagement Metrics
- Use data insights to identify high-performing content and replicate successful strategies in future campaigns.
- Experiment with different content formats, topics, and distribution channels to keep your audience engaged and interested.
- Encourage user-generated content, feedback, and discussions to foster a sense of community and engagement around your brand.
- Optimize your content for different platforms and devices to reach a wider audience and enhance engagement opportunities.
Tools for Tracking Content Engagement Metrics
When it comes to tracking content engagement metrics, there are several popular tools that marketers and content creators can utilize to measure the performance of their content. These tools offer valuable insights into how audiences are interacting with the content, helping to optimize strategies for better engagement and conversion rates.
Popular Tools for Tracking Content Engagement Metrics
- Google Analytics: A powerful and widely-used tool that provides detailed data on website traffic, user behavior, and content performance. It offers a range of metrics to track engagement, such as bounce rate, time on page, and conversion rates.
- HubSpot: Another popular tool that offers content analytics features to monitor engagement metrics like click-through rates, social shares, and lead generation. It also provides insights on audience demographics and behavior.
- SEMrush: Known for its capabilities, SEMrush also offers content engagement tracking tools that help analyze how content is performing across different channels and platforms. It provides data on performance, backlinks, and more.
Features of Different Content Analytics Tools
- Google Analytics: Offers a comprehensive set of metrics and reports to track content performance, user engagement, and conversion goals. It also allows for custom tracking and segmentation for more targeted analysis.
- HubSpot: Provides a user-friendly interface with easy-to-understand dashboards and reports to monitor content engagement metrics. It also integrates with other marketing tools for a seamless workflow.
- SEMrush: Focuses on and content marketing, offering insights into performance, competitor analysis, and content optimization strategies. It also provides recommendations for improving content engagement.
Leveraging Tools to Optimize Content Performance
To make the most of these tools for tracking content engagement metrics, it’s essential to set clear goals and KPIs for measuring success. Regularly monitor key metrics like page views, shares, and conversions to identify trends and areas for improvement. Additionally, use A/B testing and experimentation to refine content strategies and drive better engagement with the target audience.


